702-660-7000
702-660-7000

Return on investment is typically reported as simple averages rather than compound annual growth rates or internal rates of return. This is dangerous. And here is why.
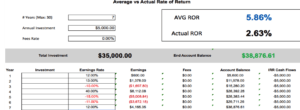
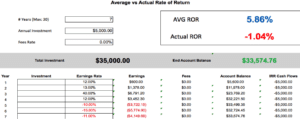
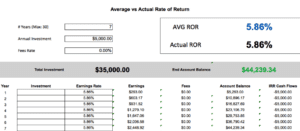
Take an average rate of return of 5.86%. This average is the result of multiple returns over multiple time periods where each individual return is added to the previous return and the sum of the returns is then divided by the number of time periods involved. In this case, that equals 5.86%. Below are three separate 5.86% average rate of returns illustrated for your perusal. Notice that the actual rate of return (aka, compounded annual growth rate or the internal rate of return) is not identical in each of these examples even though the average rate of return is.


 Assume you anticipated an average 5.86% rate of return over 7 years in your Mutual Funds, 401(k), Roth or IRA. However, due to market conditions, which are completely out of your control, annual returns have materialized according to the second example rather than the third example.
In fact, in this example this means the difference between end account balances is the difference between earning a profit and making a loss. (I.e., $44,239.34 – $35,000.00 = $9,239.34 and $33,574.76 – $35,000.00 = -$1,425.24.) This illustrates the dangers associated with anticipating average.
You are now stuck with $33,574.76 instead of $44,239.34, a whopping – 24.11% difference over what you were anticipating. And the worst part about it is…there is absolutely nothing you can do about it retrospectively.
Understanding the difference between average and actual rate of returns is critical to your future. NEVER anticipate the average!
ALWAYS determine the actual or compound annual growth rate. But better still ALWAYS mandate GUARANTEED compound annual growth rate because then the negative annual returns, when they do occur, will NEVER diminish your actual returns. With guaranteed compound annual growth you can securely plan for your future instead of speculating (gambling) on your future. And that could mean the difference between you really living or merely existing.
Take some time with your own numbers. Always remember that living may be contingent on your own money in the very year the market takes a negative turn. Historically this has happened in 1903, 1907, 1917, 1920, 1931, 1937, 1941, 1946, 1957, 1962, 1966, 1969, 1974, 1977, 1981, 2000, 2001, 2002 and 2008.
And finally, don’t forget to contemplate that the S & P 500 between 1999 and 2014 generated an average rate of return of 5.04% but actually only returned 3.28%. That means your dollar would have grown $0.67 in that 15 year time period.
For comparison purposes note that over the same amount of time, 15 years, between 1985 and 2000 the S & P 500 averaged 14.62% while returning an actual 13.79%. A dollar in 1985 would have grown another $6.90 by 2000. That’s a 26.96% difference between the average returns of 1999 through 2014 and the average returns of 1985 and 2000. This is what happens when you speculate instead of confirm guaranteed returns.
Importantly, all these rates and returns bear significance for your future. If you don’t comprehend them fully today you will most likely pay the unintentional costs they will bring you in the future. Today is the day to plan for your future judiciously by avoiding the dangers of anticipating averages and securing the guarantees of actual rates of return.
Call 702-660-7000 today for support and assistance, we can help.